
Protocol Risk Assessment
Could your trial miss a real treatment effect?
We review your protocol to identify and prioritize risks that could weaken your efficacy signal. Using AI, we perform an evidence-based assessment that exposes hidden sources of measurement error and recommend how to prevent, detect, and mitigate them during your trial.
See our extensive track record of publications on the impact of measurement error on clinical trials
How measurement error can reduce statistical power
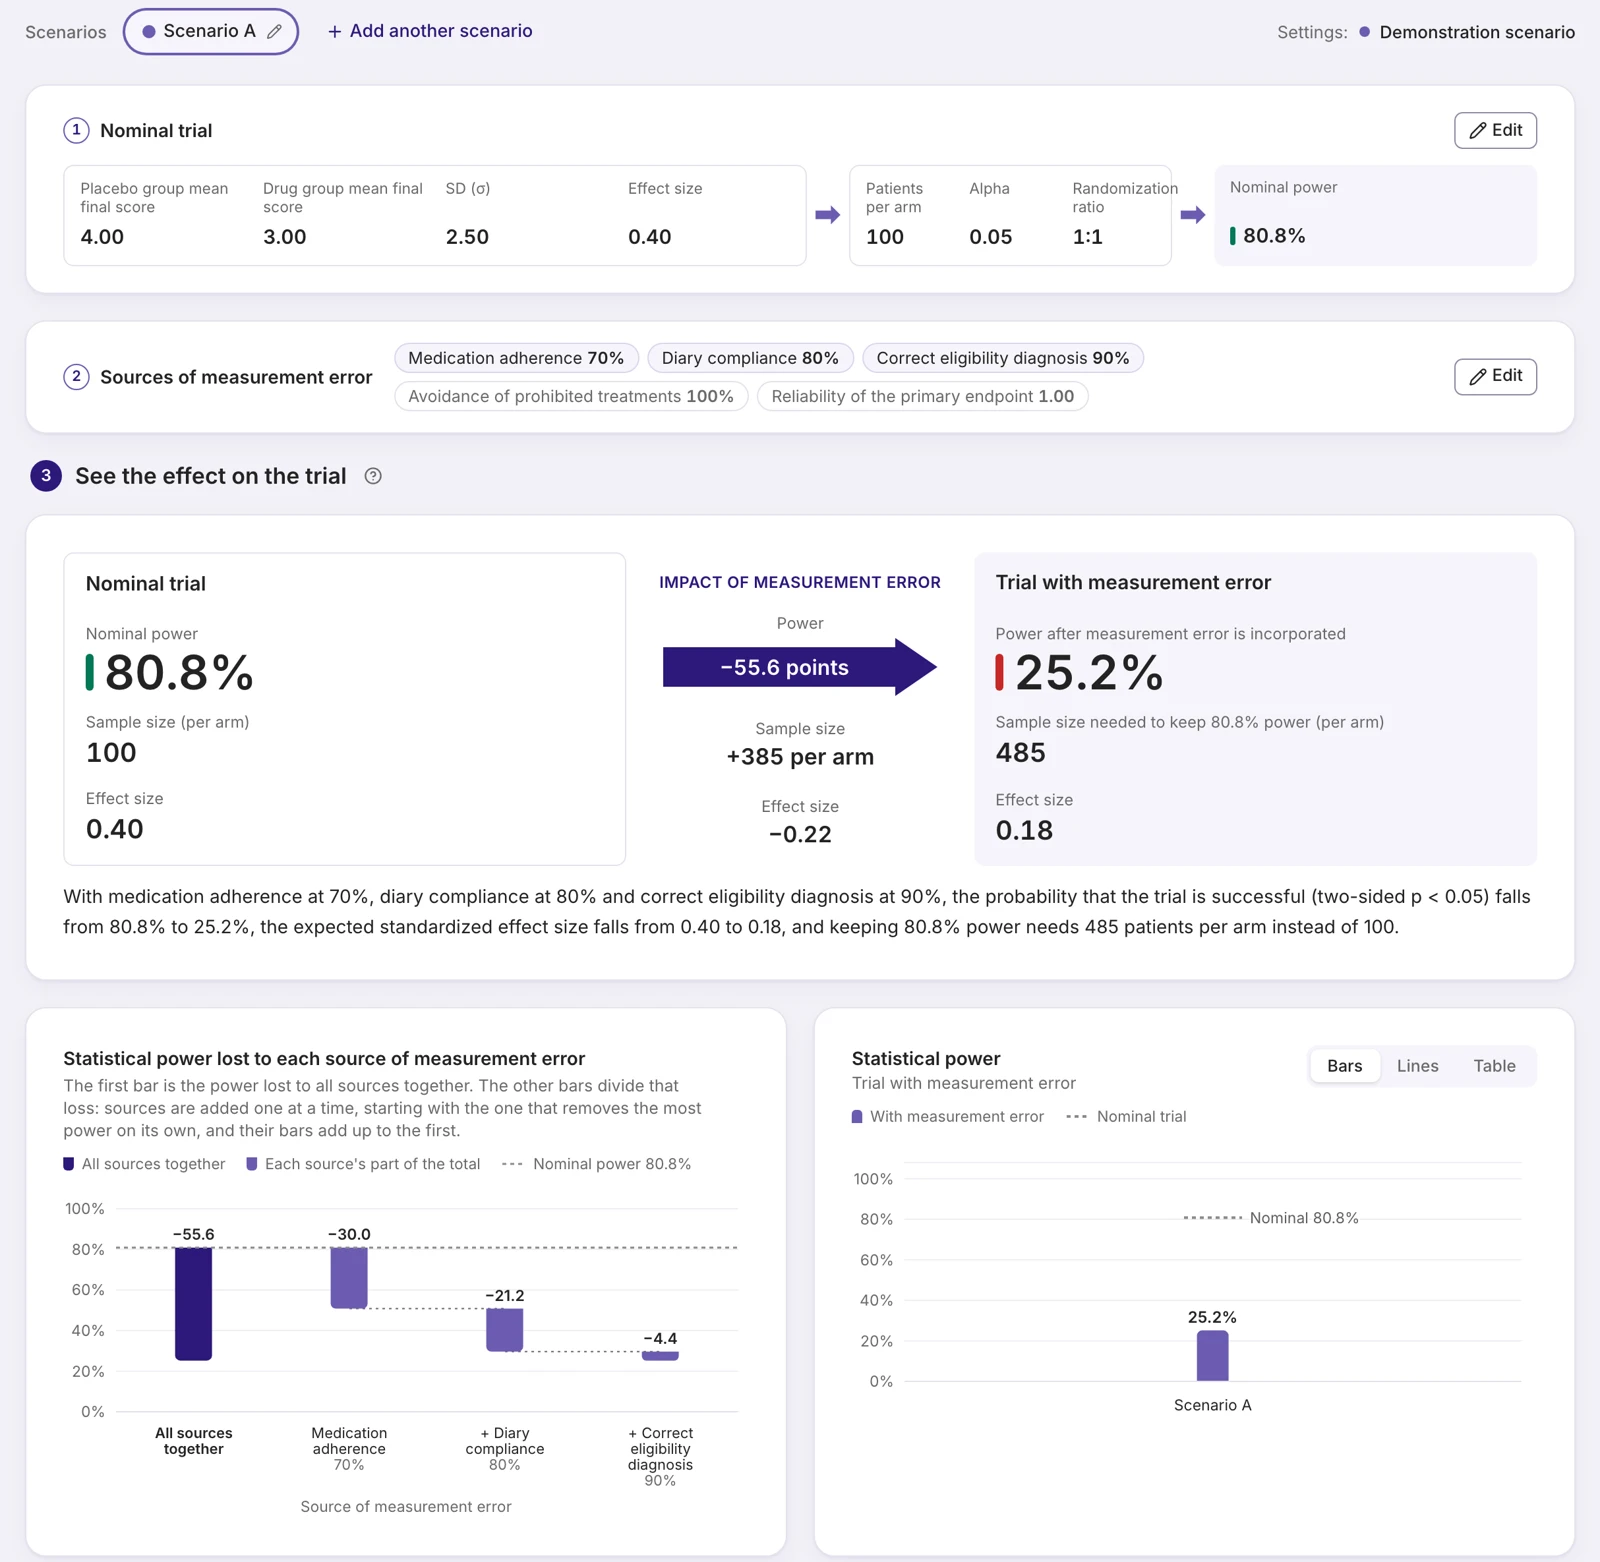
Example trial: 100 patients per arm
Without measurement error
80.8%
statistical power
With measurement error
25.2%
statistical power
Illustrative results from the VCS Measurement Error Impact Simulator™, based on the model’s assumptions.
Our process
Our experts carry out the Protocol Risk Assessment, supported by VCS Protocol Risk Insight™, including the VCS Measurement Error Impact Simulator™.
Identify the risks
We evaluate your protocol to identify sources of measurement error that could affect your trial’s ability to detect a treatment effect.
Assess their impact
We explore how those sources—individually and together—could affect statistical power.
Recommend actions
We prioritize the risks and recommend practical ways to prevent, detect, and address them.
What you receive
A Data Quality Risk Assessment (DQRA) documenting the risks, recommended actions, and what to monitor, together with simulator results where the model applies.
Why do so many clinical trials fail to show efficacy?
Many sources of measurement error can degrade the efficacy signal of even the most potent treatment.
Some common examples include:
- Missed dosesDilute the treatment effect
- Prohibited treatmentsMask the treatment effect
- Unreliable symptom reportingBlur the endpoint
- Patient expectationsInflate the placebo response
Exposing them is not enough. We recommend targeted surveillance of what matters and interventions to mitigate these risks, so your team catches problems while they are still easy to fix.
Background reading: measurement error in clinical trials
Katz N. Design and conduct of confirmatory chronic pain clinical trials. Pain Reports. 2021;6(1):e845. doi:10.1097/PR9.0000000000000854
Simulator example
Even modest degrees of measurement error substantially reduce the probability of a successful trial
Statistical power of the example trial in the VCS Measurement Error Impact Simulator™.
- 80% or more
- 60–79%
- 35–59%
- Below 35%
ICH E6(R3)
Are you ready for ICH E6(R3)?
The guideline asks sponsors to:
- DesignBuild quality into the trial, around the factors critical to its qualitya
- IdentifyIdentify risks to those factors before and during the trialb
- EvaluateWeigh each risk’s likelihood, detectability and impact on participants and resultsc
- ControlControl each risk in proportion to its importanced
- MonitorWhere it fits the trial, review accumulated data centrally to spot potentially unreliable data in timee
ICH E6(R3): aPrinciple 6, 6.2; Section 3.10 bSection 3.10.1.1 cSection 3.10.1.2 dSection 3.10.1.3 eSections 3.11.4, 3.11.4.2
This is what the guideline asks of you. We give you the tools to do it.
Our assessment exposes and weighs the sources of measurement error in your protocol, recommends proportionate controls and shows what to monitor centrally. This supports the guideline’s risk identification, evaluation and control activities, helping your team address risks that could weaken the treatment signal.
Get started
Let’s discuss your priorities.